
As part of our dedication to delivering the most effective solutions for our current and prospective customers, we partner with a few select companies that offer ‘built for NetSuite’ software, and we’ve been welcoming partners to guest blog for us.
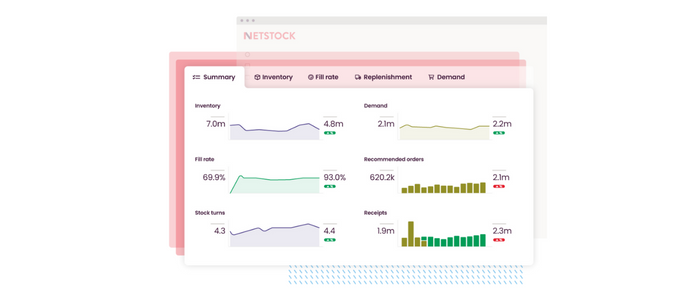
Netstock is one such cloud app that allows businesses to keep track of their stock, inventory forecasts and reordering processes in a very complex and integrated way. However, this complexity is taken out of the picture for the user – automated activities paired with visual dashboards make for effortless management, better cash flow control and increased revenue.
Dave Walton, Netstock’s UK&I General Manager, who is also delivering a webinar on the subject on Wednesday, 20 July 2022, explains what the cloud solution brings to the table for inventory heavy firms. Read on to understand what would be required to achieve the same level of insight through manual processes.
Todays’ ERP solutions, like Oracle NetSuite, cover a vast array of functionality from the core financials through to the manufacturing and operational requirements where needed. The standard inventory functionality in NetSuite is perfect for a smaller business that only manages a few hundred stock items, but when you start to add in complexities such as multiple warehouses, BOM’s and thousands of inventory items, an integrated inventory management tool takes efficiency and control to the next level.
We have found many companies attempt to manage their inventory by exporting sales and order information into a spreadsheet where they perform calculations to assist with their forecast and demand planning. This method is not only time consuming but is also prone to human error. Errors that can end up costing the business a fortune not only in terms of financial but reputational damage as well. JP Morgan felt financial pain when they were hit with a $6 billion trading loss due to an Excel copy and paste error in the infamous London Whale debacle. This is just one amongst hundreds of cases, providing further evidence that human error in spreadsheets is a significant concern.
Besides the time consuming and error-prone nature of spreadsheets, let’s look at what a spreadsheet would need to do to give you what an inventory management tool would provide.
Item classification
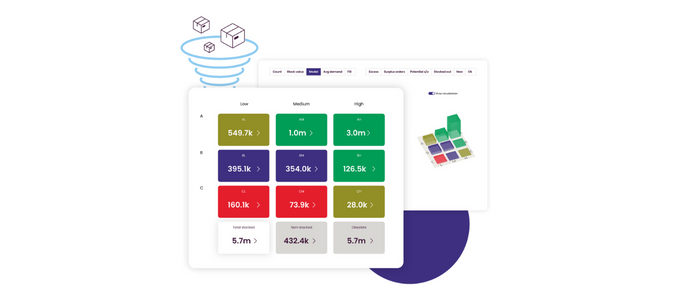
Firstly, the basis of an inventory management system lies in the classification of your items. Once the foundation is laid (i.e., your items are classified), only then can you proceed with setting up your inventory policies and parameters. Inventory planners most commonly use the ABC analysis. This criterion arranges your items according to their value, i.e., your A = highest value, B = medium value, and C = lowest value. However, using this analysis in isolation has its downfalls. Some inventory management solutions like Netstock introduce a second criterion, which we refer to as the HML criterion. This criterion is based on your sales velocity, H = high, M = medium, and L= low. Overlaying the ABC with the HML analysis is far more precise. It allows you to focus on the items that are your money spinners instead of wasting time on the ‘noise.’
Consider this data in a spreadsheet – managing 1 set of classification criteria may be pretty straightforward, but as soon as you introduce the 2nd criteria across a few thousand inventory items, it could become rather messy.

Supplier performance
Your supplier performance history is directly related to your demand forecasting. This requires that you look at your purchase order information and compare it against your goods received information. This data would need to be exported from NetSuite and manually entered into your spreadsheet. However, this data should be cleaned first before its exported. Then, there will be a few anomalies that you need to strip out so as not to skew the results. Anomalies such as goods that were air freighted in on special orders or orders where there was an unexpected delay. You’ll need to think about partial shipments and blanket orders, and are they part of the metric or not? Taking these anomalies out of your NetSuite data is imperative for supplier performance measurement. In the process of getting this data into a spreadsheet, there is a high chance of data entry errors, AND the matter of wasted time once again becomes an issue. This data is also static and will need to be continuously updated. Every time a new GRN is created, you have to drag it across manually.
Sales & previous forecast history
Now it’s time to take your sales history and map that to your previous forecasts to check your level of accuracy and predictability. Again, this involves re-entering sales and previous order information and using complex formulas to get the results, which are only as up to date as your last manual data input.
One crucial aspect, not to lose sight of, was when you placed the order, a forecast was used for that order. If that was, for example, three months ago, that forecast could have been changed three times by now. You CANNOT measure today’s forecast against that sales history. You have to measure the historical forecast that was used when placing the order. This window is known as the cover forward period. The best option is to average out the forecast attempts for each of the months in the periods leading up to that point. As you can imagine, this can get complicated in a spreadsheet and creates quite a calculation load on Excel.
The accuracy of that forecast versus sales, or forecast risk, is a critical input to calculating the buffers needed for the business to achieve the fill rates. It is also essential that you measure these accuracies and feed this back to the sales team.

Target fill rate
Setting up target fill rates per item starts to get even more entertaining in a spreadsheet. The target fill rate on your fast movers needs to be higher than your slow movers. The higher the target fill rate, the more safety stock is held to buffer the supply and demand risk. When you factor in desired target service levels, lead times, order cycles, supplier performance for a preferred vendor, forecast accuracy, and any minimum order quantities or multiples, to start getting accurate buffer levels per product, this adds even more complexity to your spreadsheet.
Your spreadsheet now consists of hundreds, if not thousands of rows and columns, formulas, and links. All of which need to be manually updated and managed.
Demand forecasting
This is where it gets even more hair raising. Consider trying to forecast demand in a seasonal business or forecast for an item that has zero units sold BUT only because there was no stock availability. Or, when you have a new item – how would you treat that in terms of order forecasts? The number of mathematical equations involved when it comes to providing an accurate forecast is considerable. And how do you get the computer to decide which formula is best for each item? The chances of human error in these types of equations can be exceptionally high and can dramatically affect your bottom line.
There are so many algorithms required for item classifications alone, not to mention the complex forecast engine algorithms needed to give you a true and accurate picture of your inventory that to try and run these in Excel is no easy task. If you want to make informed ordering decisions and manage your inventory using data insights that matter, you need to look at an integrated inventory management system.
NetSuite and Netstock work together to provide a holistic inventory solution and Netstock’s partnership with BrightBridge means you can have confidence in these two powerful tools being implemented swiftly to meet your exact current – and future – requirements. Netstock delivers the data insights and intelligence needed to forecast your inventory requirements accurately, and NetSuite is ready to execute these tasks to completion. The two solutions together create a more balanced and profitable inventory outcome.
If you think Netstock would be a beneficial addition to your business, why not join our upcoming webinar – entitled ‘Make smarter inventory decisions and adapt to changes in your supply chain’ – on Wednesday, 20 July at 10am? Click here to find out more and register for free… and if the date isn’t convenient, sign up so you can receive the recording and watch on-demand.
Alternatively, call us on 0330 133 5000 for an initial discussion about your inventory management requirements.
Keep reading

What is a NetSuite implementation partner? How do you choose one?

Technology fit for total customer service in 2024

Retail and wholesale distribution: how to improve supply chains

Ditching Sage 1000: what you need to know from businesses that have done it

6 ways AI-ready Microsoft Dynamics 365 helps chartered associations serve members

6 retail and wholesale distribution challenges and how NetSuite solves them

The most exciting features in Microsoft Dynamics 365 2023 Release Wave 2
How to manage a new NetSuite Release: one expert's update process

What’s in NetSuite Release 2023.2?