
One of the less-shouted-about benefits of being a BrightBridge customer is access to our free, bi-monthly Customer Roundtable events. At these online talks, which are exclusive to BrightBridge customers, we get our in-house NetSuite experts and sometimes guests (watch this space!) to share their expertise and help fellow users make the most of Oracle NetSuite.
This article was kindly written by one of our NetSuite Consultant’s – Lorna Durose – to share the wisdom from her recent Roundtable about customising financial statements. Lorna began using NetSuite in previous finance and accounting roles and it quickly became a firm favourite! Lorna’s extensive financial experience means she knows the importance of flexibility in reporting – and how to build a cracking report too. Take it away, Lorna!
Data is the lifeblood of any business – especially financial data.
NetSuite has a whole host of standard reports and statements which are available out of the box. These are incredibly useful but, in my experience, I know that not all organisations will want to rely on these “vanilla” statements – especially for their internal reporting.

Thankfully, one of the ways you can get the most out of NetSuite is by taking full advantage of its ability to customise financial statements and reports. In fact, there are countless things you can customise, optimise, and tweak in NetSuite.
Why Customise Your Financial Statements?
Basic versions of statements like your profit and loss and balance sheets are super informative – they’ve stood the test of time, after all. You’ll be glad to hear that industry accepted versions of these reports are available in NetSuite as standard.
But when it comes to internal reporting needs, financial statements can – and probably should – be customised to your teams’ individual needs and focus. Here are three core reasons why you might want to tweak any internal financial statements:
1. To Create More Specifically Insightful Statements
The standard versions of your financial statements may not answer specific questions that you need answering internally, or may not include data points or comparisons that you consider crucial. By customising your own reports, you can shine a spotlight on the information that is important to you.
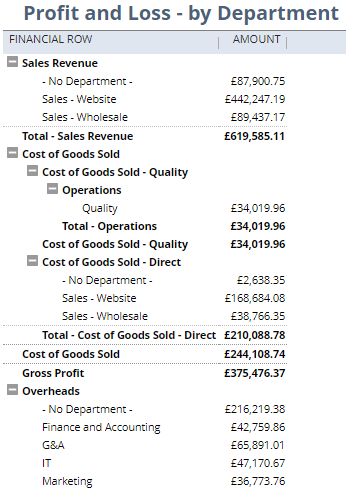
In my talk, I gave the example of grouping specific departments under custom headings within your profit and loss (P&L) sheet which may be more useful to you than grouping by individual account. Likewise, it may be useful to break down your balance sheet by location – “yes we have £3 million in assets… but where are they?”
2. To Create Multiple Versions of Statements to Enable Comparisons
You may also want to see the impact of certain departments or expenses on your gross margin and compare the “with” and the “without” figures.
Later in our roundtable, I gave an example of comparing margins if you were to include and exclude the Quality Assurance team’s expenses from your Cost of Goods. In NetSuite, QA costs won’t necessarily fall under COGs accounts by default, so you would have to customise a report to be able to see your data from that perspective.
3. To Summarise Your Financials for Key Stakeholders
We all know that key stakeholders like department heads and board members are incredibly busy. Creating a custom, ultra-simple report helps your stakeholders understand the top line summary without getting bogged down by the noise of other data.

Financial Statements: NetSuite’s Basics
Before we go any further, we need to know about five key financial statements NetSuite provides out of the box:
- Balance Sheet
- Profit and Loss (Sometimes called your “Income Statement” depending on your software version)
- Cash Flow Statement
- Trial Balance
- General Ledger (Transaction Report/Nominal Listing)
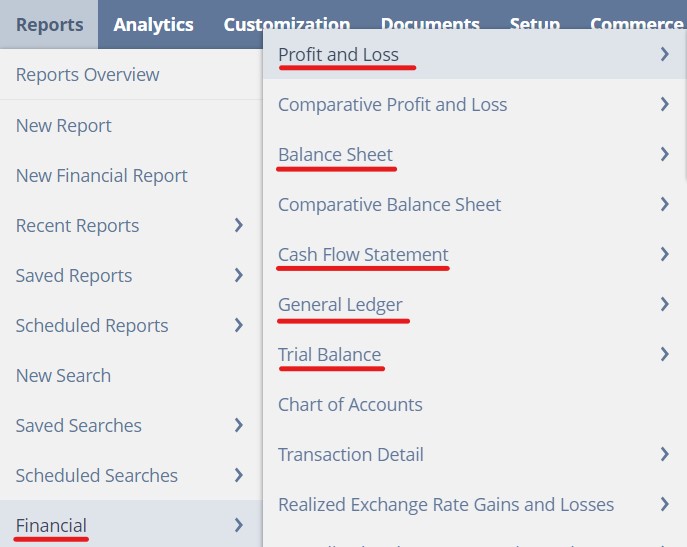
You can find these under the Reports tab on your navigation bar, depending on your user permissions. As we’ll discover, they can be used as a starting point for a whole host of customisations and data interrogation. The default versions of these reports will follow standard accounting conventions for your locality.
By the way, all reports that NetSuite generates can be exported as Excel spreadsheets, Word Documents, PDFs, CSV files, or can be printed or emailed of course. It’s also worth mentioning that any report that has a single column of financial data can be turned into a table-like matrix – for example, breaking down the year’s P&L figures into separate months.
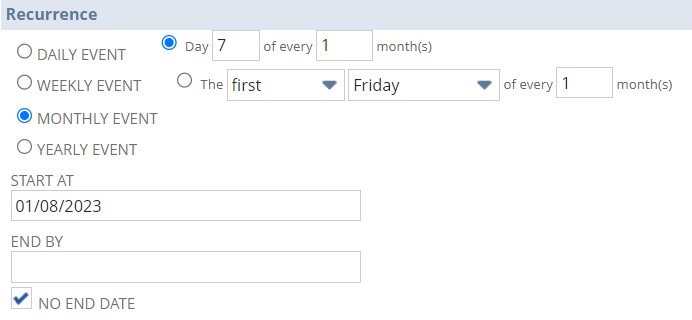
One particular favourite function of mine is that you can schedule any report to be sent by email on a regular basis. For example, if your CEO needs to see the profit and loss statement every month by a set date, you can set a schedule through NetSuite that emails the P&L to them every month on a set day. Nobody has to manually export the report and send it to them from then on – it’s all done automatically.
NetSuite’s standard P&L includes all of the data points you might expect, including:
- Income Accounts
- Cost of Sales accounts
- Gross Profit
- Expense Accounts
- Operating Profit
- Other Income/Expense
- Net Profit/Loss
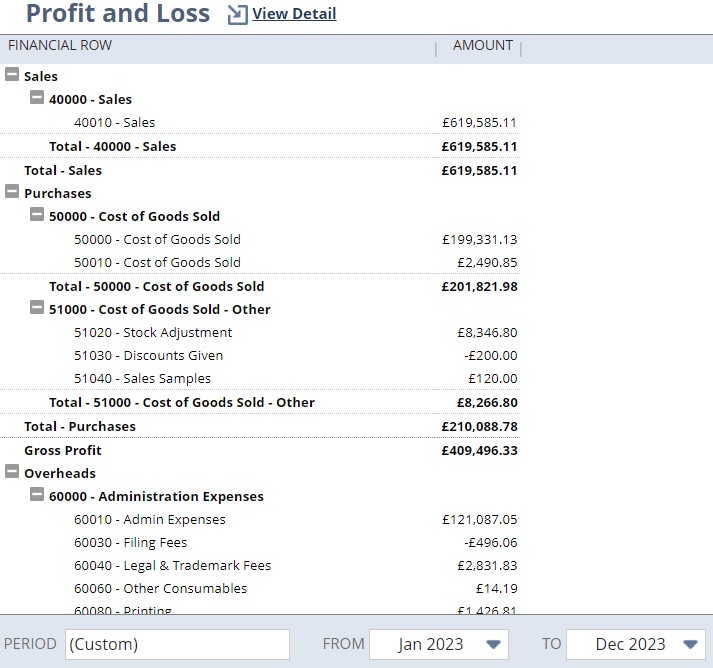
NetSuite lets you drill down into these different summary headers using an “expand and collapse” function, so you can get as granular or high-level as you like with the data. These will generally be segmented by “account type” buckets – not by any other segmentations like departments, locations, class, etc.
This is where customisations come in.
Have you seen our other functionality focus blogs?
> How and why you should customise your Oracle NetSuite dashboard
> NetSuite’s Saved Search feature
Financial Statements, But Better
To show off NetSuite’s report customisations, I’ve formulated three examples that may provide a bit of inspiration as to what is possible.
1. Profit and Loss with Simple Departmental Split
Depending on who’s going to be reading your P&L, the standard format may be a little fragmented for its intended audience. For example, the “Administration Expenses” section of overheads can contain myriad different sections, like Admin Expenses, Filing Fees, Legal & Trademark Fees, Other Consumables, Printing, Stationery, and Subscriptions. This is undoubtedly going to be informative for somebody, but it’s just going to feel like unnecessary noise to others.
With this in mind, I created a P&L where the admin overheads were grouped into more meaningful departmental buckets: “Marketing”, “Operations”, and “IT”. In my view, this gives a much clearer and more digestible picture of where the organisation’s money is going.
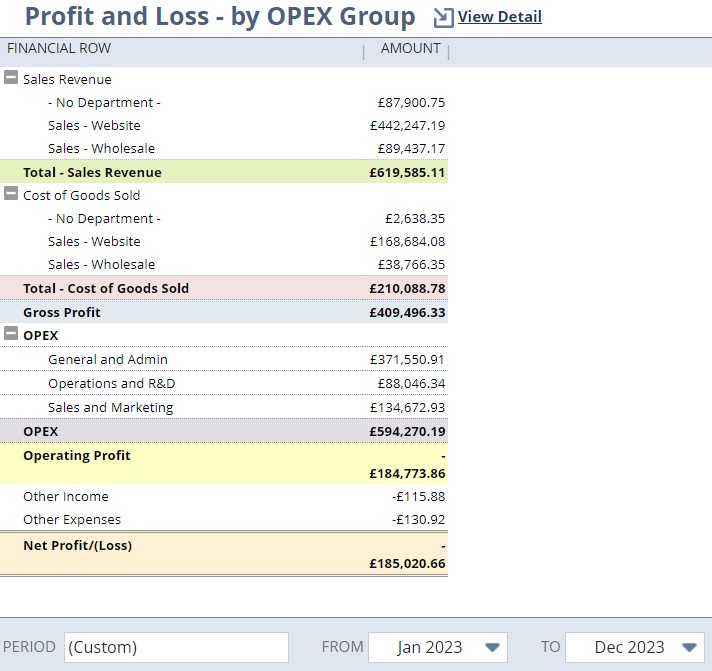
2. Profit and Loss with Department Groupings
In this example, I simplified the expenses from the above report even further into an Operating Expenses subsection, which drills down into “General & Admin Expenses; Ops and R&D; and Sales and Marketing”.
In this example, I also showed the ways in which you can use formatting to make reports easier to digest, with colour coded bands for each of the different totals. This makes it much more visually appealing and draws the eye to the relevant info.
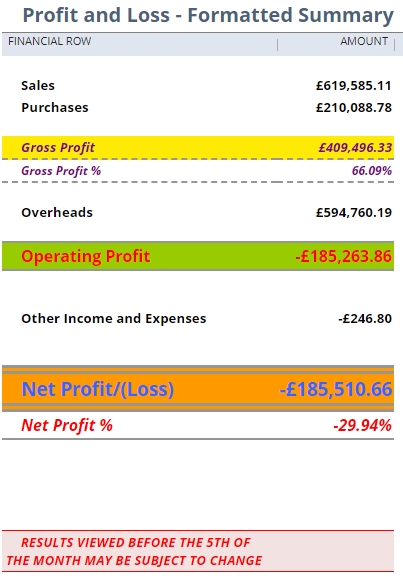
3. Profit and Loss: Board Summary
For the board summary, I created an ultra-simplified version of the P&L report for the time-poor C-Suite. I added a custom title and included formula rows that calculate the percentages of gross and net profits. You can also include text rows to give extra information, disclaimers, or simply to help space out the report.
How to Customise Financial Statements in NetSuite
This was the part of the roundtable where I gave a live demonstration of setting up a custom report. Let’s explore this particular scenario:
Our company sells products where quality checks are part of every order. We have a simple Profit and Loss report, but we want to see what impact the Quality department’s costs have on our Gross Profit.
The best way to start here is to find a similar report that is as close as possible in layout and logic to what you are trying to achieve – because why reinvent the wheel?
For the purposes of our scenario, I think my custom P&L with the simple departmental split is going to be our best starting point. From there, we can move the Quality department under the Cost of Goods bucket to see how it impacts profits.
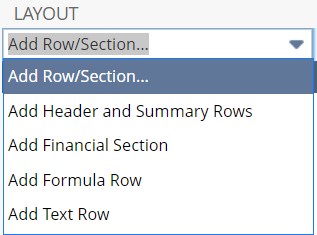
Before we get into the nitty gritty, we need to understand NetSuite’s Financial Report Builder. Our first port of call is the “Edit Layout” screen which lets you determine what data needs to go where, how you want it to be grouped, and include any formulae if needed. You can include any of the following types of data:
- Header And Summary Rows – Used for creating groupings of sections.
- Financial Sections – To group specific accounts, departments, etc. together.
- Formula Rows – Create a formula using data from the other sections.
- Text Rows – Add a line of text or add a blank row for spacing.
These new rows/sections can also be moved up or down (↑/↓), or deleted (×)
Because it works kind of like a template, you can easily create one “layout” and share that across different use cases – for example if you wanted each department to have their own P&L.
There are a number of different options available for the sections and rows, too:
Section
Used to define the criteria for which values are to be reported in the section. These can be set using multiple fixed filters including AND/OR/NOT expressions. Filters can be used against almost any segmentation (e.g., Location, Subsidiary, Department, etc.) that your business currently uses.
Format
Used to change the fonts and colours to make them stand out, which is helpful for drawing attention to key information and figures. You can also choose whether to show currency symbols or add prefixes/suffixes where required (e.g., on % calculation rows).
Grouping Order
This defines the order the rows are sorted into within each section, depending on which grouping you have selected. Some lines do not support custom sorting, but many do.
Filling Your Financial Sandwich
These different aspects go together to create a “financial sandwich” with a header layer at the top, a summary layer at the bottom, and what other details we want to see – i.e., all of our departments and groupings – in the middle.
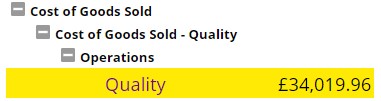
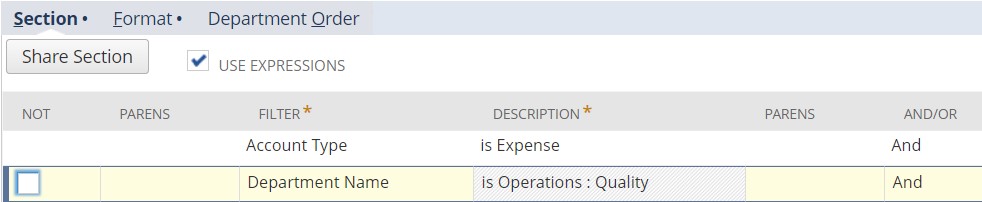
Let’s get back to our Quality department expenses scenario. I created a new section in the existing simple departmental split report, and then I used expressions to home in on anything that is both an expense AND is associated with the Quality department. I also removed the Quality department from the established “overheads” section, so it is not accounted for twice.
NetSuite is pretty good at second guessing what you’re trying to do with customisations, but it’s not a mind reader. When I first previewed this report, it was getting a little confused because I had grouped an expense as a cost, but until you have saved the report, you can easily head back to the layout screen, go to format, head to Account Row format, and reverse the +/- prefix and logic.
Saving Your Report
When you think you have everything where you need it, click “preview”. This gives you the opportunity to go back and change things and get everything right before you save the report layout to your NetSuite environment.
A word of warning about clicking “save”: if you are tinkering with an existing report in order to make a copy that better suits your needs, always click “save as” and not “save”. Clicking “Save” will overwrite your existing report which may be being used by other people. Always remember to click “save as” when duplicating something – it’s better to be safe than sorry!
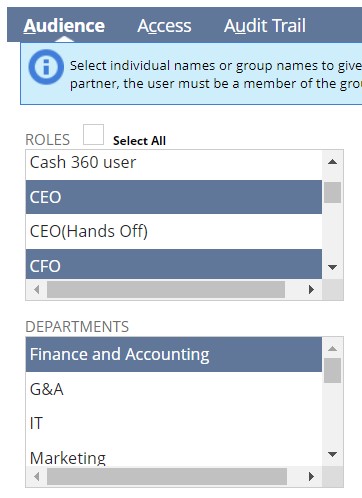
Under “More Options” you can also control what departments or roles can see the report under the “audience” section, or you can give someone temporary “access” when they need to look at a report just this once.
If you’re not using NetSuite, does your current setup allow for this level of customisation? If you’re eyeing up NetSuite and you don’t have a partner lined up, BrightBridge would love to hear from you. We offer a number of perks to our users including these exclusive bi-monthly roundtable events.
So, get in touch with BrightBridge for all things NetSuite support! Who knows? You may even end up working with Lorna herself.
Keep reading

What is a NetSuite implementation partner? How do you choose one?

Technology fit for total customer service in 2024

Retail and wholesale distribution: how to improve supply chains

Ditching Sage 1000: what you need to know from businesses that have done it

6 ways AI-ready Microsoft Dynamics 365 helps chartered associations serve members

6 retail and wholesale distribution challenges and how NetSuite solves them

The most exciting features in Microsoft Dynamics 365 2023 Release Wave 2
How to manage a new NetSuite Release: one expert's update process

What’s in NetSuite Release 2023.2?